Using the
Davis Vantage Pro 2
Weather Station
on Linux
by Joe Jaworski
last updated: 01-APR-2016
Table Of Contents
Summary
The Davis Instruments Vantage Pro 2 Weather Station is a relatively low cost, professional weather station designed for home use. This article describes the hardware and software necessary to get weather data from a Davis Vantage Pro2 Weather Station to one or more html web pages via a Linux server.
This website and the software downloads has been updated to work only with the Vantage Pro2. If you have the original Vantage Pro you can download the older software here.
Overview
The Vantage Pro2 is actually my fourth station. I started out with an Oregon Scientific WMR-918 and then moved to the WMR-968 because of numerous problems. It turned out that the 968 wasn't much better. In 2004 I purchased the Davis Vantage Pro (wired). I ran this station for 9 years, The only problem I had was the magnetic reed switch crapped out (on the rain see-saw) which was a $10 part to replace. Other than that, it worked flawlessly.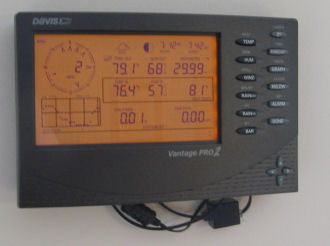
When I moved to a new house last year, I left the Vantage Pro behind and purchased a brand new Vantage Pro 2. I again went with the wired version. Years ago there were many problems with the wireless version that I'm sure have been worked out by now. But I do know a lot about rechargeable batteries and they do not like to operate in below freezing weather or in extreme heat, so I went wired. Davis uses standard RJ flat phone cable for the sensor arrays, so the cable can be tucked away and tacked into any little crack or crevice. Just buy a cheap RJ-11 crimper at Radio Shack and a roll of phone cable and you can custom make the wire to fit any installation. In my case, the 100 ft cable that came with the Vantage Pro was actually too long, so I cut it down to size and crimped on a new connector to one end.
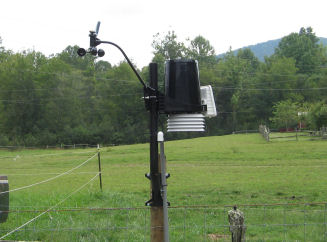
I mounted my station on a fence post about 50 feet from the house (photo at top of page). If you mount it on a pole or on the side of your house its pretty easy to run the cable under the eaves or siding. To hide the power supply cord I ran the power cable in the wall and connected everything up at the bottom. Finally, I installed a keystone plate and a run of cable to my Ubuntu server. It made for a very clean installation not having wires hanging down from the console box.
The small gray box houses a serial to ethernet converter to convert the Davis serial RS232 data to a TCP port.
WeatherLink
In order to get RS-232 serial data in and out of the console, you have to buy the Davis Weatherlink 6510SER Windows software. In the package is a small potted module with a proprietary connector on one end and an RJ-11 jack on the other. 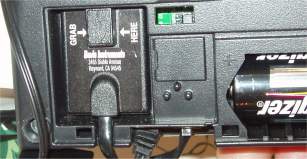 The module plugs into a slot inside the battery compartment on the back of the console. The module has a phone jack that runs to a DB-9 connector. This is what gives you RS-232 communication capability. Note that there is no way to get data out of the console without this hardware module. It is not a simple adapter but actually contains an EEPROM and possibly its own mcu. So what you have to do is buy the WeatherLink Windows Software and then throw away the software. It sounds stupid, but that's the way it goes in this Windows-centric world.
If you can live with a used one, you can find these for sale on Ebay from time to time. Davis also makes a USB version of the module, which is the exact same thing but includes an FTDI usb to serial chip built-in. It is more expensive than the regular serial version and runs at the same 19200 baud rate, so really no advantages and a waste of money.
A word of caution- unplug the console and remove a battery before plugging in the serial module. I didn't do this and it resulted in the weather data getting scrambled with garbage data. In other words, you want to completely turn the power off to the console before installing. After the module is installed, a new menu item will appear in the setup menu that allows you to set the baud rate. I have mine set at 19200, which is the maximum that Davis recommends.
Davis via TCP
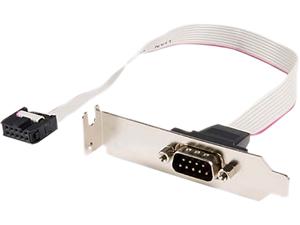 If the console is located within 25 feet of your server, you can simply plug the serial port into your server and your good to go. If you don't have a serial port on your server, for $5 you can pick up a serial adapter cable and bracket. Every motherboard sold today has at least one serial port- they just don't bring it out with the back connectors anymore. So you install the $5 serial adapter in a PCI slot and connect the cable to the motherboard and now you have a true stty port.
As an alternative, you could spend more money and get a USB to RS232 dongle. Just be careful which one you choose because some of these won't work under Linux.
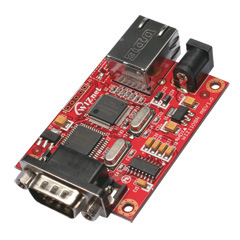 In my installation, the console is located on a dining room wall and my server is on the other side of the house. What I did is pick up a serial to TCP adapter. I went with the Wiznet 110SR which I bought at Sparkfun for $29.
This inexpensive module works well. The only drawback is that there is no built-in web server so you have to run a windows configuration program to set up the baud rate, TCP address, port, etc. The config program is kind a cheesy. It has a search function that's supposed to find the module on the network, which never worked for me. Fortunately, you can enter its IP address in the Direct search box which worked for me every time. So do it this way if you run into this issue.
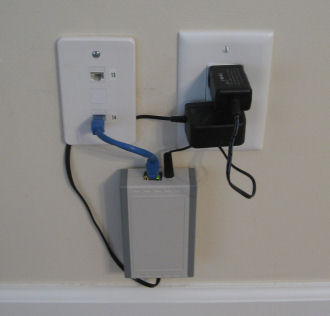
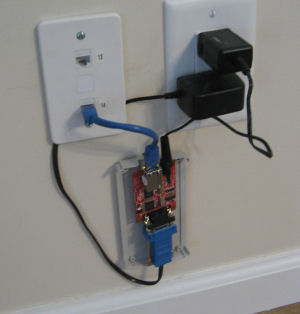 I mounted the adapter in a small plastic enclosure and attached it to the wall using Velcro. You'll need a 5V DC adapter to power it (5VDC @ 220mA). I had an old 5V adapter laying around which I used. The Davis also runs on 5V, so I thought about using the one adapter and splicing in another barrel connector. But The Davis adapter is really small and their is no specs on its current consumption, so I didn't want to take a chance and overload it.
From this point, you could use a wifi gaming adapter or hardwire an ethernet cable. I chose the latter. You can see the keystone plate next to the AC outlet that connects the Ethernet output from the Wiznet card to my LAN.
The Software
There are several pieces of software that makes it all happen. Here is a summary of each component and what they do:REMSERIAL
Download: http://lpccomp.bc.ca/remserial/
The remserial program, written by Paul Davis, allows the Wiznet adapter to appear as a local tty port on your Linux server. This is what makes it possible to access the weather station console remotely over an Ethernet connection. You run the remserial program as a background (daemon) task. Any program that accesses a stty port controlled by remserial will actually be talking to the Wiznet serial adapter. You can also use 'socat' to do this, though remserial will log debug messages to /var/messages and has other options that I find useful.
The remserial program talks to the 'master' side of a pseudo-tty device and a TCP/IP port on the other. The vproweather program (described below) opens the slave side of the pseudo-tty, thinking it is talking to a serial port, when it is actually talking to the remserial program. It passes the traffic through to the remote TCP/IP address and port set in the Wiznet adapter.
As an example, if the Wiznet adapter is set up with a static IP address of 192.168.0.8 with its port set to 5001, the remserial program can be started as:
remserial -d -r 192.168.0.8 -p 5001 -l /dev/remserial1 /dev/ptmx &
This will create a pseudo stty device named /dev/remserial1 that can be used with minicom or any serial comm software and acts like a real stty port. The '-d' flag and the ending ampersand character runs the program as a daemon. You could add this line to rc.local so it runs on startup, or include it in a script (see my weathproc.pl program below). Note: you will need to 'sudo' or have superuser rights to create/access a /dev/ device.
See the README file in the remserial package for more information.
VPROWEATHER
Download: vproweather-1.1.tar.gz (54K)
VPROWEATHER is the heart of this whole project. This program is responsible for communicating with the Davis Vantage Pro 2 console. It reads the various sections of EEPROM and real time data, and outputs its finding to stdout. It also allows you to control different aspects of the weather station. vproweather provides the following major functions:
Real Time Data This option allows you to retrieve the real time data from the console. This is most of the information you see on the LCD display.
Highs/Lows Data This option retrieves highs and lows data as related to weather items such as temperature extremes, highest rain rate, lowest wind chill, etc.
Graph Data This option retrieves data sets suitable for graphing such as rainfall or temperature over the last 24 hours, 24 days, or 24 months.
How the vproweather program outputs its three types of data sets (Real Time, High/Lows, or Graphs) is through stdout. Normally you would redirect the output to a file so that another script or program can parse it (see vproreplace below). For example, to get the Highs/Lows data to a file called hilodata from the tty port /dev/remserial1, you would use the following syntax:
vproweather -l /dev/remserial1 > /tmp/hilodata
This would create a file hilodata in the /tmp directory containing the data. The hilodata file will be a plain ASCII text file with entries like the following:
hlWindHiMonth = 28
hlWindHiYear = 56
hlOutTempHiDay = 78.8
hlOutTempLoDay = 68.9
hlOutTempHiTime = 4:26PM
...
The above example says that the highest wind for the month (hlWindHiMonth) is 28 mph. The highest wind speed for the year (hlWindHiYear) is 56 mph. The highest outside temperature so far for today is 78.8 F degrees (hlOutTempHiDay), which occurred at 4:26PM (hlOutTempHiTime). You get the idea. A complete description of every variable/value pair for each data output command is listed in the Data File Variables section.
Time functions Allows you to synchronize the clock in the weather station console with your server's system clock. Also, you can read the clock to a file, which can be used in html or logging files to record the time of weather events.
Backlite Control Allows you to turn the LCD backlite on or off. You could for example, use a cron job to turn the backlite on and off in the morning and evening, or flash the backlite during some severe weather event.
ID Functions Allows you to query the weather station for firmware version and model number/name.
The help screen for the vproweather program is as follows:
Usage: vproweather [options] device
Options:
-x, --get-realtime Get real time weather data.
-l, --get-highlow Get Highs/Lows data.
-g, --get-graph Get graph data.
-t, --get-time Get weather station time.
-s, --set-time Set weather station time to system time.
-o, --bklite-on Turn backlite on.
-f, --bklite-off Turn backlite off.
-r, --version Query for Davis firmware version string.
-m, --model Query for weather station model name.
-d, --delay=num Cmd Delay in 1/10ths seconds. Default is 10 (1 sec).
-v, --verbose Verbose mode.
device Serial Device. Required parameter.
Examples:
vproweather --get-realtime /dev/remserial1 > rtwdata.txt
Gets real time data set to file rtwdata.txt from the serial device remserial1.
vproweather --verbose --bklite-on /dev/remserial1
Turns the LCD backlite On, illuminating the display.
Options Descriptions
-x --get-realtime Sends the Real Time data set to stdout.
-l --get-highlow Sends the Highs/Lows data set to stdout.
-g --get-graph Sends the Graph data sets to stdout.
-t --get-time Gets the current time set in the console. The time is returned as a string in this form:
DavisTime = Monday, July 29, 2004 06:49 PM
You could redirect this output string to any of the data files or its own file so that the time can be used by other programs.
-s --set-time Sets the clock in the weather station console to the time set in your Linux machine. Note that there are no parameters to this option. The time is taken from the system clock. In this version of vproweather, there is no way to set the time to anything other than the system time.
-o bklite-on Turns the LCD backlite on and off.
-f bklite-off
-r --version Returns the version string from the console. This command is normally used during testing so you don‘t have to run a lot of data back and forth. The contents of the string returned will be a time and date with the word 'OK' indicating the version of the internal firmware.
-m --model Returns a string with the model name of your weather station. Again, this is good for testing and verifying communications. Note that if the model is not recognized as the Vantage Pro, vproweather will output a warning about compatibility issues with the program.
-d --delay=num This parameter specifies the amount of time to wait for data to be sent back to the server. Since RS-232 communications are asynchronous, there is no way to tell when characters will appear at the output after a command is executed. If you don't use this option, the default will be 1 second, which should be fine for most installations. However, if you frequently get wrong data counts or not enough data (you will get warnings to stderr) you may increase the delay value to compensate for this. The value specified is in 1/10ths of a second. The default value is 10 (1 second) and you may specify any number from 0 to 255. Again, you probably don't need to mess with this at all so don't use this option unless you have to.
-v --verbose Detailed descriptions of what is happening. Useful for debugging. You would probably never want to use the -v option when you are using any of the data set options( -x, -l , or -g) because the verbose messages will just wind up scattered throughout stdout and ultimately in your data files.
VPROREPLACE
Download: vproreplace-0.3.tar.gz (18K)
So now that we've got all this data in a file, we have to get it to some html web pages for display. This is where the vproreplace program comes in. It takes the variable/value pairs in the generated data files and replaces html comment tags in html files with the data. For example, suppose we have an html file called tmpl.html with the following line in it:
cat tmpl.html
The outside temperature is <!-- rtOutsideTemp --> degrees.
This will serve as our "template" file or the input to the vproreplace program. We also have a data file generated by vproweather at /tmp/rtdata that has the following line in it:
cat /tmp/rtdata
rtOutsideTemp = 78.6
Now we run vproreplace as follows:
vproreplace -t tmpl.html -d /tmp/rtdata > final.html
This takes the template file (tmpl.html) and the data file (/tmp/rtdata) and produces an output file called final.html. This file will contain the following:
cat final.html
The outside temperature is 78.6 degrees.
What vproreplace does is go through your template file and replace any variable references with the actual data from the vproweather generated data file.
There are a few rules when creating your template files. You can have any amount of whitespace (spaces or tabs) before and after the html comment tags, so that:
<!--rtOutsideTemp-->
<!-- rtOutsideTemp-- >
Will both work fine. However, do not split html comment tags across lines. Also, If you have any other html comment tags in your template files, vproreplace will not disturb them and will copy them verbatim to stdout.
The graph data files contain lists of data. These variables are generated with the -g option of vproweather. For example, running the command:
vproweather -g /dev/ttyp0 > grdata
will produce the file grdata which will have entries in it like this:
grRainRateHiByDays = 2.22,2.03,1.18,1.86,0.31,1.43,5.33,0.01, ...
grRainRateHiByDaysTime = 2:07PM,3:50PM,12:58PM,2:22PM, ...
grTimeRefDays = 6/30,7/1,7/2,7/3,7/4,7/5,7/6,7/7,7/8, ...
The variables always consist of 24 comma separated values. If the template file contains a line like this:
<p>On <!-- grTimeRefDays[1] --> at <!-- grRainRateHiByDaysTime [1] -->, The rain rate was <!-- grRainRateHiByDays[1] -->> inches per hour.</p>
The vproreplace program will produce the following output:
<p>On 7/1 at 3:50PM, The rain rate was 2.03 inches per hour.</p>
For graph data, you specify the index of the data you want by placing a number in brackets after the variable name. The index can range from [0] to [23]. Note that to get the first entry, you specify a value of zero and not 1. There must not be any spaces between the variable name and the brackets. If you leave out the brackets, the entire string of comma separated values will be returned. So that:
<p>The rain rate was <!-- grRainRateHiByDays --> inches per hour.</p>
Would produce the string:
<p>The rain rate was 2.22,2.03,1.18,1.86,0.31,1.43,5.33,0.01,0.00,0.00,4.80, 0.65,0.11,0.00,1.26,0.00,0.00,2.53,0.00,0.00,0.00,0.00,0.00,0.00 inches per hour.</p>
Which is probably not what you intended.
Metric Converter
Download: metconv.tar (10K)
The native output format of the data from the Vantage Pro 2 is in english units. If you need to convert to metric, Mike Kelly of Sydney, Australia (mike_at_kirrawee.net) has written a perl script that takes the output of vproweather and converts all the data to metric. This neat perl script converts Fahrenheit to Celsius, inches to millimeters, miles to kilometers, inches of mercury to millibars, and even swaps the date and month. Simply run the vproweather generated files through the script via stdin and stdout to convert the data to the metric system.
The Glue
Download: webpages.tar.gz (197K)
Download: weather.tar.gz (12K)
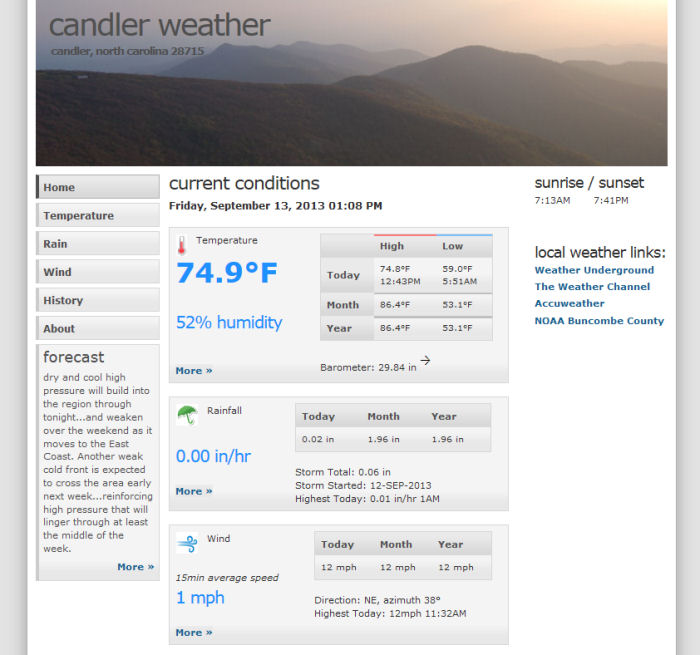
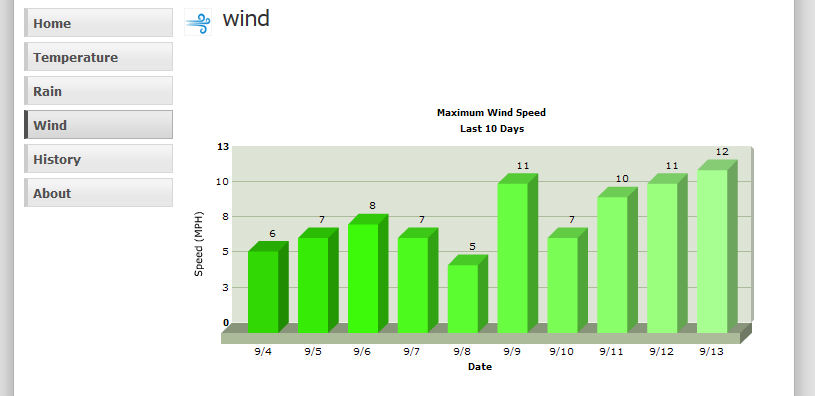
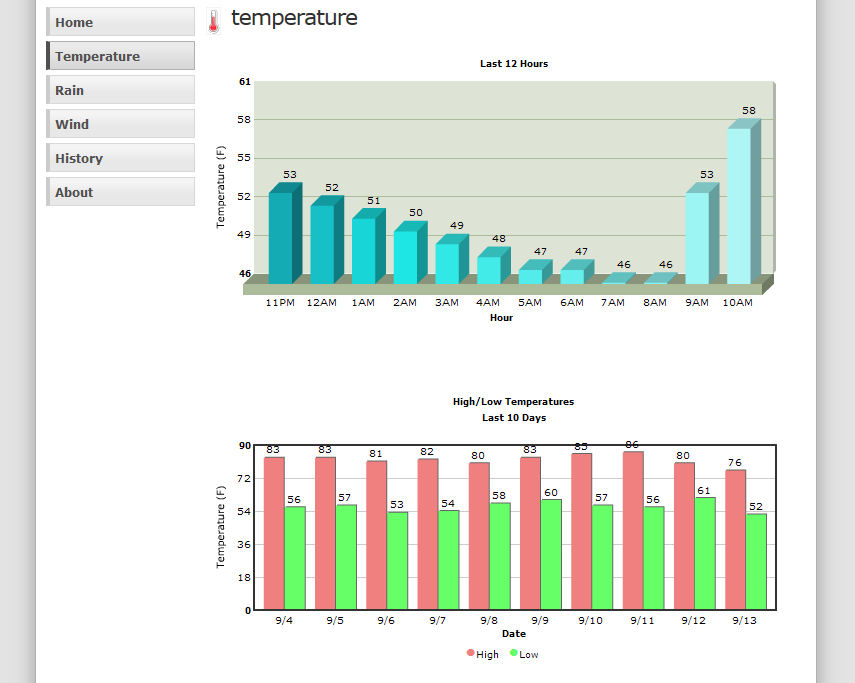
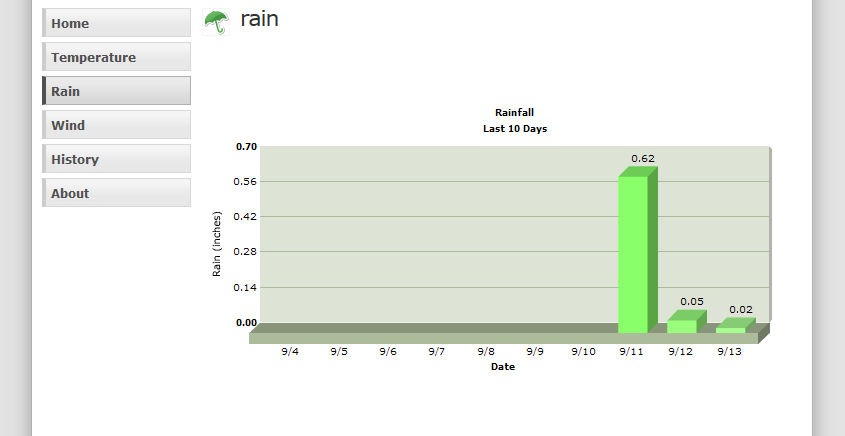
Above is a screen shot of my main html page showing the data collected from the Vantage Pro 2. I have 3 other pages for Wind, Temperature, and Rain. Using some perl scripts and a graphing package, I've automated the entire process so you don't need to run vproweather/vproreplace or do any parsing of the weather data. All the files to do this are included so you can download the whole mess then modify it to your liking.
To set this up, extract the two tarballs above and place the contents of the 'webpages' directory into /var/www/public/weather (or wherever your apache installation keeps html files). Place the 'weather' directory in root as well as the directories vproweather-1.1 and vproreplace-0.3.
There is a script called weathproc.pl that runs everything. Before using, modify the variables at the top of the file to suit your own weather setup. The script does the following:
- If remserial is not running, it starts it as a daemon.
- Calls vproweather to get either real time or extended data from the serial port.
- Gets the current forecast from a text file and inserts the text (see the screenshot 'Forecast' box on the left hand side).
- It calls vproreplace to parse through the .tmpl files (which are html files) then copies the resulting html pages to /var/www/public/weather.
- /root/weather/weathproc.pl -r This gets the realtime data like current temperature, current wind speed, etc. My cron job runs this every 5 minutes to keep the web pages updated frequently.
- /root/weather/weathproc.pl -x This gets the graph data and hourly/daily data. My cron job runs this every 30 minutes.
- /root/weather/gethtml.pl This is the script that grabs the forecast synopsis from the NOAA pages and creates a text file. Modify this script to include your own city and state name. NOAA updates this usually 2 or 3 times a day, so my cron job runs this every 8 hours.
An important thing to remember when setting up the cron jobs is that the serial port is not a multi-threaded entity and if you happen to run two copies of vproweather at the same time, they will both fail as the serial port will get clobbered with data from two different sources. Make sure that you stagger the two weathproc.pl cron jobs so they don't run at exactly the same minute. For example, my 'weathproc.pl -r' runs at minutes 5,10,15,20, etc. while 'weathproc.pl -x' runs at minutes 1 and 31. The perl script will actually wait for vproweather to end before running it, but to be safe just don't run multiple copies of weathproc.pl at the same time. Here is what my cron lines look like:
5,10,15,20,25,30,35,40,45,50,55 * * * * /root/weather/weathproc.pl -r
1,31 * * * * /root/weather/weathproc.pl -x
6,8,16,23 * * * /root/weather/gethtml.pl
Data File Variables
The output of vproweather produces lists of data containing the following definitions:
Real Time Data Real Time Data output is invoked by using the -x option with vproweather. The following lines are generated:
| Value = Example | Description |
| DavisTime = Tuesday, July 27, 2004 07:55 PM | Actually, this variable is created by using the -t switch in conjunction with any of the data output switches (-l -g or -x). It represents the current time obtained from the weather station console when the data was retrieved. |
| rtBaroTrend = Falling Slowly | 3-hour Barometer Trend. This value will only be available if you have the Rev. B firmware. It can be one of the following values: "Falling Rapidly", "Falling Slowly", "Steady", "Rising Slowly", "Rising Rapidly", or "n/a". |
| rtBaroTrendImg = baro_none | This provides the same data as rtBaroTrend, but is a single non-whitespace word that can be used to reference a gif or other image in your web page. The strings returned are "baro_fr", "baro_fs", "baro_s", "baro_rs", "baro_rr", or "baro_none". |
| rtBaroCurr = 29.92 | Current barometer in Hg/in. |
| rtInsideTemp = 77.9 | Current inside temperature in degrees Fahrenheit. |
| rtInsideHum = 41 | Current inside humidity as a percent. |
| rtOutsideTemp = 69.1 | Current outside temperature in degrees Fahrenheit. |
| rtWindSpeed = 4 | Current wind speed in miles per hour. |
| rtWindAvgSpeed = 2 | Average wind speed in miles per hour over the last 15 minutes. |
| rtWindDir = 8 | Current direction of wind in compass degrees. |
| rtWindDirRose = NNW | The wind direction in Compass Rose values. The value will be NNE, NE, ENE, E, ESE, SE, SSE, S, SSW, SW, WSW, W, WNW, NW, or NNW. You can use these to display 1 of 16 images representing the position of the compass. |
| rtOutsideHum = 88 | Current outside humidity as a percent. |
| rtRainRate = 0.04 | Current rate retrainer in inches per hour. |
| rtIsRaining = yes | The value is "yes" is it's raining and "no" if it's not. |
| rtUVLevel = n/a | Current UV level. Note that I added the code for this, but did not have a UV sensor available during my project development. So this may or may not work. |
| rtSolarRad = n/a | Current Solar Radiation. Note that I added the code for this, but did not have a solar radiation sensor available during my project development. So this may or may not work. |
| rtRainStorm = 0.28 | The amount of rain in inches from the current storm. |
| rtStormStartDate = 27-JUL-2004 | Date that the current storm started. Rain storms are started when it starts raining, and end when it doesn't rain for 24 hours. |
| rtDayRain = 0.28 | Total rain so far in inches for today. |
| rtMonthRain = 3.54 | Total rain so far in inches for the month. |
| rtYearRain = 25.37 | Total rain so far in inches for the year. |
| rtDayET = 0 | The Evapotranspiration rate for today. Note that I added the code for this, but did not have a solar radiation sensor available during my project development. So this may or may not work. |
| rtMonthET = 0 | The Evapotranspiration rate for the month. Note that I added the code for this, but did not have a solar radiation sensor available during my project development. So this may or may not work. |
| rtXmitBattt = 0 | Voltage level of the transmitter batteries. Note that I added the code for this, but did not have a wireless Vantage Pro available during my project development. So this may or may not work. |
| rtBattVoltage = 4.3 | Voltage level of the console batteries. This is only meaningful if the unit is running on batteries. It will be an unusually high value if running off the AC power. |
| rtForeIcon = 6 | A number representing the forecast icon appearing on the LCD display of the console. You can use this information to display your own forecast icon. Note: This has been updated. You may have to tweak the sample web pages to make the icons come out right with these new numbers: 23 - cloudy, sun, rain, and snow 2 - cloudy 3 - cloudy and rain 22 - cloudy, sun, and snow 19 - cloudy, rain, and snow 6 - cloudy with sun 7 - cloudy, sun, and rain 8 - sun 18 - cloudy, snow |
| rtForeRule = 45 | This is a compound number used to generate the forecast strings that are displayed on the console when the forecast button is pressed. To get the actual forecast strings, use the rtForecast variable. |
| rtForecast = Partly cloudy with little temperature change. | This is a variable length string of the forecast text. This is the same text that is displayed on the console when the forecast button is pressed. |
| rtSunrise = 6:35AM | Time of Sunrise today. |
| rtSunset = 8:38PM | Time of Sunset today. |
| Highs / Lows Data The Highs/Lows Data output is invoked by using the -l option with vproweather. The following lines are generated: |
| Value = Example | Description |
| hlBaroLoDay = 30.00 | The lowest barometer reading in Hg/in so far today. |
| hlBaroHiDay = 30.14 | The highest barometer reading in Hg/in so far today. |
| hlBaroLoMonth = 29.66 | The lowest barometer reading in Hg/in so far this month. |
| hlBaroHiMonth = 30.14 | The highest barometer reading in Hg/in so far this month. |
| hlBaroLoYear = 29.45 | The lowest barometer reading in Hg/in so far this year. |
| hlBaroHiYear = 30.61 | The highest barometer reading in Hg/in so far this year. |
| hlBaroLoTime = 2:59PM | The time that the hlBaroLoDay value was recorded. |
| hlBaroHiTime = 8:29AM | The time that the hlBaroHiDay value was recorded. |
| hlWindHiDay = 14 | The highest recorded wind speed in miles per hour for today. |
| hlWindHiTime = 3:10AM | The time that the hlWindHiDay value was recorded. |
| hlWindHiMonth = 28 | The highest recorded wind speed in miles per hour for this month. |
| hlWindHiYear = 49 | The highest recorded wind speed in miles per hour for this year. |
| hlInTempHiDay = 78.8 | The highest indoor temperature in degrees Fahrenheit for today. |
| hlInTempLoDay = 68.9 | The lowest indoor temperature in degrees Fahrenheit for today. |
| hlInTempHiTime = 4:26PM | The time that the hlInTempHiDay value was recorded. |
| hlInTempLoTime = 5:28AM | The time that the hlInTempLoDay value was recorded. |
| hlInTempLoMonth = 68.0 | The lowest indoor temperature in degrees Fahrenheit for this month. |
| hlInTempHiMonth = 81.6 | The highest indoor temperature in degrees Fahrenheit for this month. |
| hlInTempLoYear = 58.0 | The lowest indoor temperature in degrees Fahrenheit for this year. |
| hlInTempHiYear = 81.6 | The highest indoor temperature in degrees Fahrenheit for this year. |
| hlInHumHiDay = 46 | The highest indoor humidity in percent for today. |
| hlInHumLoDay = 38 | The lowest indoor humidity in percent for today. |
| hlInHumHiTime = 4:31PM | The time that the hlInHumHiDay value was recorded. |
| hlInHumLoTime = 12:01AM | The time that the hlInHumLoDay value was recorded. |
| hlInHumHiMonth = 58 | The highest indoor humidity in percent for the month. |
| hlInHumLoMonth = 35 | The lowest indoor humidity in percent for the month. |
| hlInHumHiYear = 59 | The highest indoor humidity in percent for the year. |
| hlInHumLoYear = 28 | The lowest indoor humidity in percent for the year. |
| hlOutTempHiDay = 86.1 | The highest outside temperature in degrees Fahrenheit for today. |
| hlOutTempLoDay = 64.0 | The lowest outside temperature in degrees Fahrenheit for today. |
| hlOutTempHiTime = 2:32PM | The time that the hlOutTempHiDay value was recorded. |
| hlOutTempLoTime = 6:43AM | The time that the hlOutTempLoDay value was recorded. |
| hlOutTempLoMonth = 52.3 | The lowest outside temperature in degrees Fahrenheit for the month. |
| hlOutTempHiMonth = 89.0 | The highest outside temperature in degrees Fahrenheit for the month. |
| hlOutTempHiYear = 90.0 | The highest outside temperature in degrees Fahrenheit for the year. |
| hlOutTempLoYear = 10.0 | The lowest outside temperature in degrees Fahrenheit for the year. |
| hlDewLoDay = 62 | The lowest dew point in degrees Fahrenheit for today. |
| hlDewHiDay = 71 | The highest dew point in degrees Fahrenheit for today. |
| hlDewLoTime = 3:31AM | The time that the hlDewLoDay value was recorded. |
| hlDewHiTime = 1:55PM | The time that the hlDewHiDay value was recorded. |
| hlDewHiMonth = 75 | The highest dew point in degrees Fahrenheit for the month. |
| hlDewLoMonth = 43 | The lowest dew point in degrees Fahrenheit for the month. |
| hlDewHiYear = 81 | The highest dew point in degrees Fahrenheit for the year. |
| hlDewLoYear = 22 | The lowest dew point in degrees Fahrenheit for the year. |
| hlChillLoDay = 64 | The lowest wind chill in degrees Fahrenheit for today. |
| hlChillLoTime = 6:28AM | The time that the hlChillLoDay value was recorded. |
| hlChillLoMonth = 52 | The lowest wind chill in degrees Fahrenheit for the month. |
| hlChillLoYear = -5 | The lowest wind chill in degrees Fahrenheit for the year. |
| hlHeatHiDay = 91 | The highest heat index in degrees Fahrenheit for today. |
| hlHeatHiTime = 2:26PM | The time that the hlHeatHiDay value was recorded. |
| hlHeatHiMonth = 92 | The highest heat index in degrees Fahrenheit for month. |
| hlHeatHiYear = 96 | The highest heat index in degrees Fahrenheit for the year. |
| hlSolarHiDay = 0.0 | The highest solar radiation value for today. This has not been fully tested. |
| hlSolarHiTime = n/a | The time that the hlSolarHiDay value was recorded. This has not been fully tested. |
| hlSolarHiMonth = 0.0 | The highest solar radiation value for the month. This has not been fully tested. |
| hlSolarHiYear = 0.0 | The highest solar radiation value for the year. This has not been fully tested. |
| hlUVHiDay = 0.0 | The highest UV index value for today. This has not been fully tested. |
| hlUVHiTime = n/a | The time that the hlUVHiDay value was recorded. |
| hlUVHiMonth = 0.0 | The highest UV index value for the month. This has not been fully tested. |
| hlUVHiYear = 0.0 | The highest UV index value for the year. This has not been fully tested. |
| hlRainRateHiDay = 0.00 | The highest rain rate in inches per hour for today. |
| hlRainRateHiTime = n/a | The time that the hlRainRateHiDay value was recorded. |
| hlRainRateHiHour = 0.00 | The highest rain rate in inches per hour for the last hour. |
| hlRainRateHiMonth = 5.33 | The highest rain rate in inches per hour for the month. |
| hlRainRateHiYear = 57.60 | The highest rain rate in inches per hour for the year. |
| Graph Data The Graph Data output is invoked by using the -g option with vproweather. The output is a list of 24 values separated by commas with no whitespace. The following lines are generated: |
| Value = Example | Description |
| grTimeRef10Min = 3:10AM,3:20AM,3:30AM, ... | Time reference that can be used with 10-minute data sets below. |
| grTimeRef15Min = 1:15AM,1:30AM,1:45AM, ... | Time reference that can be used with 15-minute data sets below. |
| grTimeRefHours = 7:00AM,8:00AM,9:00AM, ... | Time reference that can be used with hourly data sets below. |
| grTimeRefDays = 6/30,7/1,7/2,7/3, ... | Time reference that can be used with daily data sets below. |
| grTimeRefMonths = JUL,AUG,SEP, ... | Time reference that can be used with monthly data sets below. |
| grTimeRefYears = 1979,1980,1981, ... | Time reference that can be used with yearly data sets below. |
| grInTempByHours = 72,73,75, ... | Inside temperature by hour. |
| grInTempHiByDays = 76,77,76, ... | Highest inside temperature by days. |
| grInTempHiByDaysTime = 4:11PM,5:46PM,8:48PM, ... | Time of highest inside temperature by days. |
| grInTempLoByDays = 68,68,69,70, ... | Lowest inside temperature by days. |
| grInTempLoByDaysTime = 5:45AM,5:46AM,4:28AM, ... | Time of lowest inside temperature by days. |
| grInTempHiByMonths = 74,79,83, ... | Highest inside temperature by months. |
| grInTempLoByMonths = 58,59,60, ... | Lowest inside temperature by days. |
| grOutTempByHours = 70,71,71, ... | Outside temperature by hour. |
| grOutTempHiByDays = 77,79,75, ... | Highest outside temperature by days. |
| grOutTempHiByDaysTime = 11:51AM,1:42PM,4:40PM, ... | Time of highest outside temperature by days. |
| grOutTempLoByDays = 60,61,65, ... | Lowest outside temperature by days. |
| grOutTempLoByDaysTime = 5:25AM,1:35AM,11:58PM, ... | Time of lowest outside temperature by days. |
| grOutTempHiByMonths = 63,75,83, ... | Highest outside temperature by months. |
| grOutTempLoByMonths = 25,30,46, ... | Lowest outside temperature by days. |
| grDewByHours = 66,66,67, ... | Dew point by hour. |
| grDewHiByDays = 66,69,71,71, ... | Highest dew point by days. |
| grDewHiByDaysTime = 12:42PM,4:50PM,3:44PM, ... | Time of highest dew point by days. |
| grDewLoByDays = 58,60,62,64, ... | Lowest dew point by days. |
| grDewLoByDaysTime = 3:10AM,1:15AM,7:12AM, ... | Time of lowest dew point by days. |
| grDewHiByMonths = 57,57,64, ... | Highest dew point by months. |
| grDewLoByMonths = 14,8,16,19, ... | Lowest dew point by months. |
| grChillLoByHours = 68,70,71, ... | Lowest wind chill by hour. |
| grChillLoByDays = 60,61,65,65,62, ... | Lowest wind chill by days. |
| grChillLoByDaysTime = 2:48AM,1:22AM,12:00AM, ... | Time of lowest wind chill by days. |
| grChillLoByMonths = 18,18,28, ... | Lowest wind chill by months. |
| grHeatHiByHours = 72,73,73, ... | Heat index by hour. |
| grHeatHiByDays = 78,81,77, ... | Highest heat index by days. |
| grHeatHiByDaysTime = 12:16PM,1:24PM,4:39PM, ... | Time of highest heat index by days. |
| grHeatHiByMonths = 61,73,82, ... | Highest heat index by months. |
| grInHumByHours = 39,40,41, ... | Inside humidity by hour. |
| grInHumHiByDays = 46,45,48, ... | Highest inside humidity by days. |
| grInHumHiByDaysTime = 1:31PM,12:09PM,3:04PM, ... | Time of highest inside humidity by days. |
| grInHumLoByDays = 39,40,40, ... | Lowest inside humidity by days. |
| grInHumLoByDaysTime = 12:00AM,9:57PM,12:00AM, ... | Time of lowest inside humidity by days. |
| grInHumHiByMonths = 74,100,87, ... | Highest inside humidity by months. |
| grInHumLoByMonths = 032,30,32,39, ... | Lowest inside humidity by months. |
| grOutHumByHours = 87,84,85,80, ... | Outside humidity by hour. |
| grOutHumHiByDays = 96,96,96, ... | Highest outside humidity by days. |
| grOutHumHiByDaysTime = 2:55PM,12:00AM,12:00AM, ... | Time of highest outside humidity by days. |
| grOutHumLoByDays = 11:52AM,12:38PM,12:14PM, ... | Lowest outside humidity by days. |
| grOutHumLoByDaysTime = 11:52AM,12:38PM,12:14PM, ... | Time of lowest outside humidity by days. |
| grOutHumHiByMonths = 100,100,100, ... | Highest outside humidity by months. |
| grOutHumLoByMonths = 29,20,16, ... | Lowest outside humidity by months. |
| grBarBy15Min = 30.00,30.01,30.02, ... | Barometer last 6 hours in 15 minute increments. |
| grBarByHours = 29.88,29.88,29.91, ... | Barometer by hour. |
| grBarHiByDays = 30.16,30.12,30.05,29.96, ... | Highest barometer by days. |
| grBarHiByDaysTime = 8:44AM,8:14AM,2:14AM, ... | Time of highest barometer by days. |
| grBarLoByDays = 30.09,30.03,29.93,29.88, ... | Lowest barometer by days. |
| grBarLoByDaysTime = 8:14PM,5:59PM,5:44PM, ... | Time of lowest barometer by days. |
| grBarHiByMonths = 30.32,30.35,30.34, ... | Highest barometer by months. |
| grBarLoByMonths = 29.20,29.61,29.56, ... | Lowest barometer by hour. |
| grWindAvgBy10Min = 0,0,0, ... | Average wind speed last 4 hours in 10 minute increments. |
| grWindAvgByHours = 1,2,0, ... | Average wind speed by hour. |
| grWindHiByDays = 16,13,17,8,16, ... | Highest wind speed by hour. |
| grWindHiByDaysTime = 1:21PM,12:22PM,6:52AM, ... | Time of highest wind speed by hour. |
| grWindHiByMonths = 47,43,36, ... | Highest wind speed by months. |
| grWindHiByYears = 0,0,0,0, ... | Highest wind speed by years. |
| grWindDirByHours = 2,2,1,4, ... | Wind direction by hour. |
| grWindDirByDays = 0,0,0,0, ... | Wind direction by days. |
| grWindDirByMonths = 0,0,0,0, ... | Wind direction by months. |
| grRainRateByMinutes = 0.00,0.00,0.00, ... | Rain Rate by minutes. |
| grRainRateByHours = 0.00,0.00,0.00, ... | Rain Rate by hour. |
| grRainRateHiByDays = 2.22,2.03,1.18, ... | Highest rain Rate by minutes. |
| grRainRateHiByDaysTime = 2:07PM,3:50PM,12:58PM, ... | Time of highest rain Rate by minutes. |
| grRainRateHiByMonths = 16.00,0.55,2.22, ... | Highest rain rate by months. |
| grRainRateHiByYears = 0.00,0.00,0.00, ... | Highest rain rate by years. |
| grRainBy15Min = 0.00,0.00,0.00,0.00, ... | Rain last 6 hours in 15 minute increments. |
| grRainByHour = 0.00,0.00,0.00, ... | Rain in inches by hour. |
| grRainStorms = 0.37,0.28,0.52,0.89, ... | Rain in inches by storms. |
| grRainStormsStartDate = 30-APR-2004,08-MAY-2004,13-MAY-2004, ... | Start date of grRainStorms. |
| grRainStormsEndDate = 02-MAY-2004,09-MAY-2004,13-MAY-2004, ... | End date of grRainStorms. |
| grRainByDay = 0.47,0.41,0.47, ... | Rain in inches by days. |
| grRainByMonth = 0.00,0.00,4.14,3.46, ... | Rain in inches by months. |
| grRainByYear = 0.00,0.00,0.00, ... | Rain in inches by years. |